Optimal and suboptimal foldings
Next: AUXILIARY AND INDIVIDUAL PROGRAMS Up: OUTPUT Previous: The energy dot plot
Optimal and suboptimal foldings
mfold predicts a number of optimal and suboptimal foldings. They are
automatically predicted in order of increasing free energy, although this order may
change when the more exact efn2 program is used to re-evaluate free energies.
The number of computed foldings is limited directly by the MAX parameter, and in more
subtle ways by the P and W parameters. It should be stated clearly here that while the
energy dot plot rigorously displays all possible base pairs that can take part
in all possible foldings within
![]() of
of ![]() , the computation of foldings is arbitrary. They do not
represent a statistical sample of likely foldings, but rather a collection of foldings
that show the variation that is possible within optimal and suboptimal foldings.
, the computation of foldings is arbitrary. They do not
represent a statistical sample of likely foldings, but rather a collection of foldings
that show the variation that is possible within optimal and suboptimal foldings.
The collection of triples,
![]() , for all possible base pairs is sorted in order of increasing
, for all possible base pairs is sorted in order of increasing
![]() . The algorithm to construct foldings proceeds as follows:
. The algorithm to construct foldings proceeds as follows:
- The base pair at the top of the list is selected, and an optimal folding containing the selected base pair is computed.
- All base pairs in the computed folding, as well as all those within a distance of W of base pairs in the computed folding, are crossed off the list.
- The computed folding is retained if it contains at least W base pairs that were not found in previous foldings.
mfold creates a number of files associated with predicted structures. The files marked with an optional ``html'' are created only when RUN_TYPE is html. Files that contain an underscore, `_', in their names enumerate the individual foldings, so that `file_name_i.ct' refers to the ct file for the ith predicted structure.
`FILE_NAME.OUT(.HTML)' : This is a text file (html file) containing a
plain text form of output for each of the predicted foldings. It is useful because it
can always be displayed and is intelligible for foldings on short sequences. The
selected base pairs for computing each structure are specially marked with a
`|' above and a `^' below. A sample output is shown in Figure
11.
 FOLDING BASES    1 TO   76 OF tRNA
 Initial ENERGY  =     -22.3

              10
----      UUA      AGU
    GCGGAU     GCUC   U
    CGCUUA     CGAG   G
ACCA      --A      AGG
     70            20

                    30
               G       CUG
                  CCAGA
                  GGUCU   A
               -       AGA
                    40

                       50
                  AGGUC  |  UUC
                       CUGUG
                       GACAC   G
                  -----  ^  CUA
                           60
|
 |
| (a) Text | (b) Plot |
|---|
`FILE_NAME_I.CT' : The ``ct'' file (connect
table) contains the sequence and base pair information, and is meant to be an
input file for a structure drawing program. In addition to containing base pair
information, it also lists the 5'and 3' neighbor of each base, allowing for the
representation of circular RNA or multiple molecules. The ct file also lists the
historical base numbering in the original sequence, as bases and base pairs are
numbered according from 1 to the size of the folded segment. A portion of a ct file is
displayed in Figure 12.
   76   ENERGY = -24.4 [initially  -23.2]  yeast tRNA Phe
    1 G       0    2   72    1
    2 C       1    3   71    2
    3 G       2    4   70    3
    4 G       3    5   69    4
    5 A       4    6   68    5
    6 U       5    7   67    6
    7 U       6    8    0    7
    8 U       7    9    0    8
   ...
   67 A      66   68    6   67
   68 U      67   69    5   68
   69 U      68   70    4   69
   70 C      69   71    3   70
   71 G      70   72    2   71
   72 C      71   73    1   72
   73 A      72   74    0   73
   74 C      73   75    0   74
   75 C      74   76    0   75
   76 A      75    0    0   76
|
`FILE_NAME.DET(.HTML)' : This is a text file (html file) containing
the detailed breakdown of each folding into loops, and the corresponding
decomposition of the overall free energy, ![]() , into the free energy contributions,
, into the free energy contributions,
![]() , for each loop. A sample output is shown in Table 4.
, for each loop. A sample output is shown in Table 4.
|
Loop Free-Energy Decomposition Structure 3 tRNA.seq Initial Free energy = -22.3
|
`FILE_NAME.SS-COUNT' : If l foldings are predicted, then ss-count(i) is the number of times that ri is single stranded in these foldings. Thus ss-count(i)/l is a sample based probability for single strandedness. The ss-count file contains the number of computed foldings in the first record. The ithsubsequent record contains i and ss-count(i). This file may be used to predict which regions of an RNA are likely to be single stranded, and values of ss-count, averaged over a window of perhaps 5 to 25 base pairs, are often plotted. This file is also used for annotating plotted structures.
`FILE_NAME_I.PLT2' : This is an intermediate, device independent plot file. It is the output of mfold's adaptation of the naview program for plotting secondary structures. This file is used as input to the plt22ps and plt22gif programs. It was originally intended to be used as input to the plt2 plotting package [39], but this software is now old and not maintained.
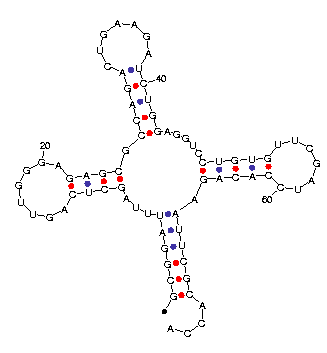
`FILE_NAME_I.PS' : This is a PostScript file of a secondary structure. It is the output of the plt22ps program.
`FILE_NAME_I.GIF' : This is an image file (gif) of a secondary structure. It is the output of the plt22gif program.
The progression from ct file to images of secondary structures is:
`file_name_i.ct'
![]() naview
naview
![]() `file_name_i.plt2'
`file_name_i.plt2'
![]() plt22ps
plt22ps
![]() `file_name_i.ps'
`file_name_i.ps'
or
`file_name_i.ct'
![]() naview
naview
![]() `file_name_i.plt2'
`file_name_i.plt2'
![]() plt22gif
plt22gif
![]() `file_name_i.gif'
`file_name_i.gif'
`FILE_NAME.HTML' : This is a simple html file that links together some of the output files. It is an early version of a format originally used by the mfold web server.
`FILE_NAME.LOG' : This is a log file containing the standard output and standard error of the various programs and scripts that make up mfold. It can be useful for debugging.
`FILE_NAME.PNT' : This is a human readable file containing the entire input sequence. Every 10th base is labeled. In addition, auxiliary information is incorporated, if there is any. Bases that are forced to be double stranded have the letter `F' underneath. Those that are forced to be single stranded have the letter `P' underneath. Pairs of rounded brackets `(` and `)' underline forced base pairs, and pairs of curly brackets `{` and `}' underline prohibited base pairs. If 2 disjoint segments are prohibited from pairing with one another, then these segments are highlighted by underlining the residues of the first with a common lowercase letter, and the residues of the second with the same letter in uppercase. Different letters are used for different prohibited pairs. `F' and `P' are not used in this case.
Next: AUXILIARY AND INDIVIDUAL PROGRAMS Up: OUTPUT Previous: The energy dot plot
 |
Michael Zuker Center for Computational Biology Washington University in St. Louis 1998-12-05 |